Flexible Pavement Design as per IRC:37-2018, Explained with a Worked Example
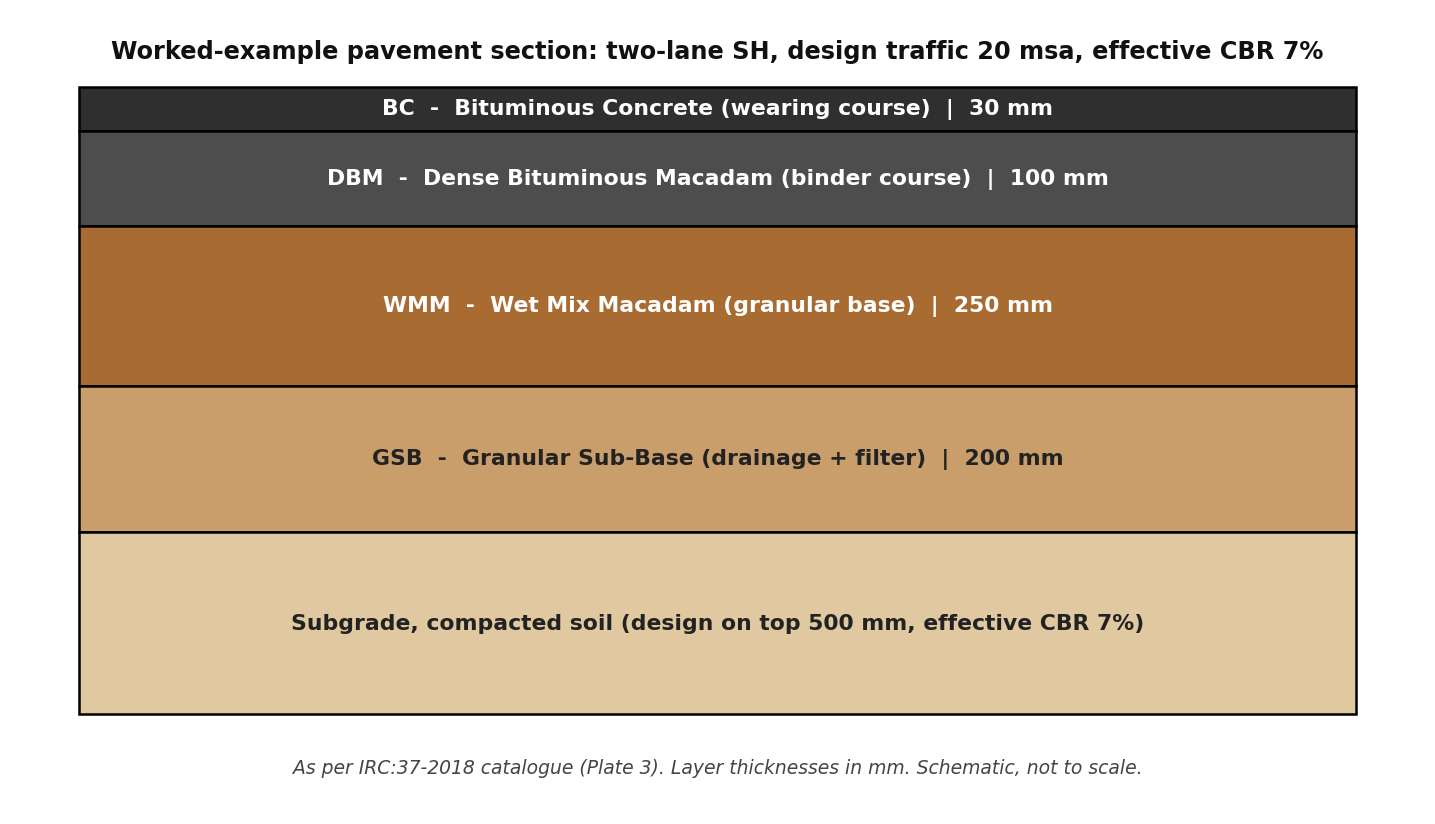
Table of contents
- 1. What Is IRC:37-2018 and When Do You Use It?
- 2. The Three Questions the Design Answers
- 3. Step 1: Work Out the Design Traffic in MSA
- 4. Step 2: Establish the Subgrade Strength (CBR)
- 5. Step 3: Pick the Layers and Read Off the Thickness
- 6. Worked Example: A Two-Lane State Highway
- 7. How Exams Ask IRC:37
- 8. Practical Notes from the Field
- 9. Key Takeaways
- Reference
IRC Codes Explained, Part 1: written for road contractors, site engineers and design engineers, and equally useful for GATE (CE), SSC JE, ESE and state AE/JE aspirants.
1. What Is IRC:37-2018 and When Do You Use It?
IRC:37, Guidelines for the Design of Flexible Pavements, is the Indian Roads Congress code used to decide how thick a bituminous (flexible) road pavement should be. Whether you are preparing a DPR for a new state highway, checking the pavement section given in a tender drawing, or pricing GSB, WMM, DBM and BC quantities in an estimate, the layer thicknesses in front of you trace back to this code.
The current edition is the fourth revision, issued in 2018, replacing IRC:37-2012. The broad approach is unchanged: design traffic is worked out in million standard axles (MSA), the subgrade strength is taken from its CBR, and layer thicknesses come from design catalogues backed by mechanistic-empirical analysis using the IITPAVE software supplied with the code. What the 2018 revision fine-tuned:
- better-performing bituminous mixes and binders for the surface and binder courses;
- guidelines for choosing elastic moduli of bituminous mixes;
- minimum thicknesses of granular and cement-treated layers from functional requirements;
- a generalized procedure for the effective resilient modulus/CBR of the subgrade;
- provision for geosynthetics in granular layers;
- a rationalized approach to stage construction; and
- indicative vehicle damage factors updated for the legal axle load limits notified in July 2018.
One boundary worth knowing: IRC:37 designs the pavement structure only. Geometric design (width, curves, gradients) belongs to other IRC codes, and overlays on an existing road are designed as per IRC:81, not IRC:37.
2. The Three Questions the Design Answers
Every flexible pavement design as per IRC:37-2018 answers three questions in order:
- Traffic. How much traffic will the road carry over its design life? The answer is the design traffic, in million standard axles (MSA).
- Subgrade. How strong is the soil below the pavement? The answer is the effective subgrade CBR, or its resilient modulus.
- Thickness. What layer composition and thicknesses will carry that traffic on that soil? The answer comes from the code’s design catalogues, checked by analysis with IITPAVE for your project inputs.
Behind the catalogue, the code treats the pavement as elastic layers and checks two main failure modes: rutting (permanent deformation) in the subgrade, and fatigue cracking at the bottom of the bituminous layer. Where cement-treated bases are used, their fatigue is checked too. The catalogue thicknesses you will use most often already have these checks built in, which is why a site engineer can use them without running the analysis every time.
3. Step 1: Work Out the Design Traffic in MSA
The design traffic is the cumulative number of standard axles the road will carry during its design period. A standard axle is a single axle with dual wheels carrying 80 kN. Only commercial vehicles are counted; cars and two-wheelers cause negligible structural damage.
Key formula (Equation 4.5 of IRC:37-2018):
N = 365 x [(1 + r)^n – 1] / r x A x D x F
Where:
- N = cumulative number of standard axles over the design period (divide by ten lakh, i.e. by 10^6, to get MSA);
- A = initial traffic in commercial vehicles per day (CVPD) in the year of completion of construction. For divided carriageways use directional traffic; for single carriageway roads use the two-way volume before applying the lane distribution factor;
- D = lateral (lane) distribution factor, from the table below;
- F = vehicle damage factor (VDF);
- n = design period in years;
- r = annual growth rate of commercial vehicles, in decimal (6 per cent means r = 0.06).
Getting each input right:
Project A from the last count. If your last traffic count P was taken x years before the year of completion, project it as A = P(1 + r)^x (Equation 4.6 of IRC:37-2018).
Design period (n). 20 years for National Highways, State Highways and urban roads; 15 years for other categories of roads. Very high density corridors (above 300 msa) and expressways should preferably be designed as long-life pavements, otherwise for a minimum of 30 years.
Growth rate (r). Estimate from past traffic data as per IRC:108, category by category. If no data is available, or the estimated growth is less than 5 per cent, take a minimum of 5 per cent per annum.
Lane distribution factor (D). How the commercial traffic spreads across the carriageway (Section 4.5 of IRC:37-2018):
| Carriageway type | Design based on |
|---|---|
| Single lane | Total commercial vehicles of both directions (D = 1.00) |
| Intermediate lane (5.50 m width) | 75 per cent of two-way commercial traffic |
| Two-lane, two-way | 50 per cent of two-way commercial traffic (D = 0.50) |
| Four-lane undivided | 40 per cent of the total commercial traffic in both directions |
| Dual two-lane (divided) | 75 per cent of the commercial vehicles in each direction |
| Dual three-lane (divided) | 60 per cent of the commercial vehicles in each direction |
| Dual four-lane (divided) | 45 per cent of the commercial vehicles in each direction |
Vehicle damage factor (F). The VDF converts the mix of commercial vehicles into equivalent standard axles. The correct way is an axle load survey: a minimum of 24 hours in each direction, sampling at least 20 per cent of commercial traffic where the volume is below 3,000 CVPD, 15 per cent (minimum 600 CVPD) between 3,000 and 6,000, and 10 per cent (minimum 900 CVPD) above 6,000 (Table 4.1 of IRC:37-2018). Where axle load data is not available and the share of heavy vehicles is small, the code allows the indicative values of Table 4.2 of IRC:37-2018:
| Initial two-way traffic (CVPD) | VDF, rolling/plain terrain | VDF, hilly terrain |
|---|---|---|
| 0 to 150 | 1.7 | 0.6 |
| 150 to 1,500 | 3.9 | 1.7 |
| More than 1,500 | 5.0 | 2.8 |
Note that these are only indicative values, based on typical axle load spectrums and the legal axle load limits notified in July 2018. On corridors with overloading, actual VDFs can be much higher.
4. Step 2: Establish the Subgrade Strength (CBR)
The pavement rests on the subgrade, so its strength fixes how much support the layers above must provide. The code’s requirements:
- How to test. Test the 4-day soaked CBR on remoulded samples compacted to at least 97 per cent of the maximum dry density from the Proctor compaction test, at optimum moisture content. (Where annual rainfall is below 1,000 mm and the subgrade is well protected, the moulding moisture may be fixed from field moisture data instead.)
- How many tests, and which value. Average at least three specimens for each soil type. For expressways, National Highways, State Highways and urban roads, adopt the 90th percentile subgrade CBR. For other roads, use the 80th percentile if the design traffic is below 20 msa, and the 90th percentile at 20 msa and above.
- Effective CBR. Design is based on the effective CBR of the top 500 mm of the subgrade. If the embankment soil below differs from the subgrade soil, the code gives a procedure (using IITPAVE) to combine them into one effective value.
- The 5 per cent floor. If the road will carry more than 450 CVPD (two-way) in the year of construction, the effective subgrade CBR must be more than 5 per cent. Weaker soil has to be improved first, by replacement or stabilization.
- CBR to modulus. For analysis, CBR is converted to resilient modulus: MR = 10 x CBR (in MPa) for CBR up to 5 per cent, and MR = 17.6 x (CBR)^0.64 for CBR above 5 per cent, capped at 100 MPa.
5. Step 3: Pick the Layers and Read Off the Thickness
The conventional flexible pavement on Indian roads is a four-layer stack over the subgrade:
| Layer | Full form | Its job |
|---|---|---|
| BC | Bituminous Concrete | Wearing course: takes the traffic directly and gives riding quality |
| DBM | Dense Bituminous Macadam | Binder course: the main structural bituminous layer |
| WMM | Wet Mix Macadam | Granular base: spreads the wheel load over the layers below |
| GSB | Granular Sub-Base | Drainage and filter layer, protects the subgrade, and serves as the working platform |
IRC:37-2018 gives design catalogues for six pavement compositions, including cement-treated base/sub-base options and long-life pavements. The commonest, bituminous surfacing with granular base and sub-base, is covered by Plates 1 to 8 (Figs. 12.1 to 12.8 of the code) for effective CBR values from 5 to 15 per cent and design traffic from 5 to 50 msa. As an example, Plate 3 (Fig. 12.3 of IRC:37-2018, effective CBR 7%) reads:
| Design traffic | BC (mm) | DBM (mm) | WMM (mm) | GSB (mm) |
|---|---|---|---|---|
| 5 msa | 30 | 50 | 250 | 150 |
| 10 msa | 30 | 70 | 250 | 200 |
| 20 msa | 30 | 100 | 250 | 200 |
| 30 msa | 40 | 100 | 250 | 200 |
| 40 msa | 40 | 115 | 250 | 200 |
| 50 msa | 40 | 125 | 250 | 200 |
A note on the catalogue. The code itself says these catalogues are for guidance and initial cost estimation. For every road with design traffic above 2 msa, the final design is to be carried out with site-specific inputs, the actual mix properties and reliability level of your project, and checked with IITPAVE, the layered-elastic analysis program supplied with the code. Use the catalogue to know the conventional section and the ballpark; use IITPAVE to finalize the design.
6. Worked Example: A Two-Lane State Highway
A new two-lane, two-way State Highway in rolling terrain is to be designed with conventional granular construction. The data:
- Last classified count: 670 CVPD (two-way), taken 2 years before the year of completion;
- Traffic growth: 6 per cent per annum; design period: 20 years (State Highway);
- Subgrade borrow soil, 4-day soaked CBR of three specimens: 6.5, 7.0 and 7.5 per cent, adopt effective CBR = 7 per cent;
- Pavement composition: BC + DBM + WMM + GSB.
Step A, traffic at opening.
A = P(1 + r)^x = 670 x (1.06)^2 = 670 x 1.1236 = 753, say 750 CVPD (two-way).
Step B, the factors.
Two-lane two-way road, so D = 0.50. Rolling terrain and 750 CVPD (in the 150 to 1,500 range), so the indicative VDF, F = 3.9. r = 0.06, n = 20 years.
Step C, the growth multiplier.
[(1 + 0.06)^20 – 1] / 0.06 = (3.207 – 1) / 0.06 = 36.79.
Step D, design traffic.
N = 365 x 36.79 x 750 x 0.50 x 3.9 = 1,96,36,000 standard axles, i.e. about 19.6 msa. Adopt the next higher catalogue column: 20 msa.
Step E, subgrade check.
The road will carry 750 CVPD at opening, which is more than 450 CVPD, so the effective subgrade CBR must exceed 5 per cent. Our 7 per cent passes.
Step F, read the catalogue.
Plate 3 (Fig. 12.3 of IRC:37-2018, effective CBR 7%), 20 msa column: BC 30 mm, DBM 100 mm, WMM 250 mm, GSB 200 mm. Total pavement thickness above the subgrade: 580 mm.
| Layer | Thickness |
|---|---|
| BC (wearing course) | 30 mm |
| DBM (binder course) | 100 mm |
| WMM (granular base) | 250 mm |
| GSB (granular sub-base) | 200 mm |
| Total above subgrade | 580 mm |
Step G, verify for the actual project.
Since the design traffic is above 2 msa, the code wants this section verified with IITPAVE using the project’s actual bituminous mix properties before it goes into a DPR or estimate. The catalogue section above is the correct starting point and the conventional answer.
7. How Exams Ask IRC:37
- MSA numerical. GATE (CE) and SSC JE ask a numerical on the design traffic formula. Marks are usually lost in three places: forgetting the lane distribution factor, using total vehicles instead of commercial vehicles, and misplacing the exponent in (1 + r)^n.
- MCQs. Expect one-mark questions on: the standard axle (80 kN, single axle with dual wheels); the 20-year design period for NH/SH; the minimum 5 per cent growth rate; the MR-CBR relations; and the fact that catalogues are for guidance while designs above 2 msa are to be checked with IITPAVE.
- Formula-based. Questions may give VDF and LDF directly and ask only for N. Practise the formula until the sequence 365 x growth factor x A x D x F is automatic.
8. Practical Notes from the Field
- Do the axle load survey. Indicative VDFs are a fallback, not a substitute. Where you can, get a real axle load survey, even 24 hours per direction. On corridors with overloading, the survey value is often far above the table value, and the indicative value would under-design the road.
- Watch directional loading. On roads serving quarries, mines, ports or industries, loaded trucks travel one way and empties return. Measure the VDF separately for each direction; for undivided roads, design on the larger of the two.
- Drainage decides pavement life. No catalogue thickness survives trapped water. The code wants the GSB drainage and filter layers carried full width, right up to the embankment slopes, so water leaves the pavement instead of sitting in it. In my experience, most premature failures trace back to drainage, not to the design traffic estimate.
- Check the GSB for construction traffic. The code requires the GSB to be checked for construction traffic, the dumpers running on it while the upper layers are built, with a minimum of 10,000 standard axle repetitions. On fast-track projects this check matters.
- Stage construction has rules. Stage construction is permitted for granular pavements, with stage-1 bituminous layers designed for 1.67 times the stage-1 traffic, but it is not allowed for cement-treated bases and sub-bases.
9. Key Takeaways
- Design traffic in MSA is 365 x growth factor x A x D x F. Get the initial commercial traffic (A), lane distribution (D) and vehicle damage factor (F) right, and the rest follows.
- Subgrade strength is the 4-day soaked CBR at 97 per cent Proctor density, taken as the effective CBR of the top 500 mm. Above 450 CVPD, it must exceed 5 per cent.
- The catalogue gives you the conventional section in one look; for any road above 2 msa, the code expects the final design to be verified with IITPAVE.
- Rounding: always round the design traffic up to the next catalogue column, never down.
- Next in this series: rigid pavement design as per IRC:58, where the same traffic estimation returns in a different form.
Reference
Every formula, factor, table and catalogue thickness in this article is taken from IRC:37-2018: Guidelines for the Design of Flexible Pavements (Fourth Revision), published by the Indian Roads Congress, New Delhi. For design work, always refer to the official code, available from the Indian Roads Congress (irc.gov.in).
Rajesh Pant is a Civil Engineer and Infrastructure Management professional with approximately 25 years of experience in the planning, implementation, coordination, management and execution of large-scale government infrastructure projects. His professional experience encompasses project management, procurement, contract administration, construction management and quality control of infrastructure projects. He also possesses nearly eight years of experience in Externally Aided Projects (EAPs), particularly in project implementation, procurement and contract management of World Bank-funded projects. His professional exposure includes working with projects financed by multilateral development organisations, providing valuable insights into international procurement practices, project implementation frameworks and contract management requirements. He holds a Master of Technology (M.Tech.) in Civil Engineering and a Master of Business Administration (MBA) in Infrastructure Management, combining technical engineering expertise with management and administrative capabilities. With extensive experience in public infrastructure development and government project management, Rajesh brings a practical, multidisciplinary perspective to the fields of contract management, procurement, project management and construction management.